Trend Hunter [forex and binary]This is an amazing script for scalp trading.
It is basically self-explanatory. Just search, add to chart and start using as per the arrows.
Feel free to comment and ask anything
You can also use the binary options methods
DO NOT
dont enable forex together with direction. Only one of them should be turned on
Best Practice
enable one option at a time on the list
forex
binary
direction
In den Scripts nach "binary option" suchen

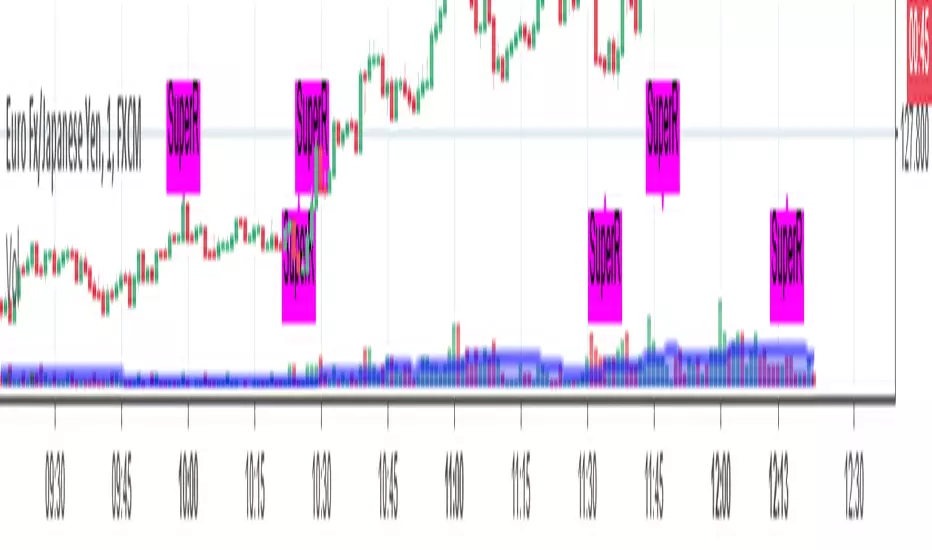
SuperR V.2Hi,
This is the same indicator but now it's more accurate. you can use it with 1- minute binary options trading. Please note that SuperR is not for FX or stock trading expect binary options. With this system, we're using 2 step of martingale.
And my indicator is for sale. once you buy it you will get permission to access indicator. as simple as that.
Mail me, if you are interested. SuperR indicator is priced at $150. once-off fee.
For more information
Drop me a mail, id is jogadiyahemlata786@gmail.com ( Ensure spelling before you send it out )
(This is officile annocenment )
Big Snapper Alerts R2.0 by JustUncleLThis is a diversified Binary Option or Scalping Alert indicator originally designed for lower Time Frame Trend or Swing trading. Although you will find it a useful tool for higher time frames as well.
The Alerts are generated by the changing direction of the ColouredMA (HullMA by default), you then have the choice of selecting the Directional filtering on these signals or a Bollinger swing reversal filter.
The filters include:
Type 1 - The three MAs (EMAs 21,55,89 by default) in various combinations or by themselves. When only one directional MA selected then direction filter is given by ColouredMA above(up)/below(down) selected MA. If more than one MA selected the direction is given by MAs being in correct order for trend direction.
Type 2 - The SuperTrend direction is used to filter ColouredMA signals.
Type 3 - Bollinger Band Outside In is used to filter ColouredMA for swing reversals.
Type 4 - No directional filtering, all signals from the ColouredMA are shown.
Notes:
Each Type can be combined with another type to form more complex filtration.
Alerts can also be disabled completely if you just want one indicator with one colouredMA and/or 3xMAs and/or Bollinger Bands and/or SuperTrend painted on the chart.
Warning:
Be aware that combining Bollinger OutsideIn swing filter and a directional filter can be counter productive as they are opposites. So careful consideration is needed when combining Bollinger OutsideIn with any of the directional filters.
Hints:
For Binary Options try ColouredMA = HullMA(13) or HullMA(8) with Type 2 or 3 Filter.
When using Trend filters SuperTrend and/or 3xMA Trend, you will find if price reverses and breaks back through the Big Fat Signal line, then this can be a good reversal trade.
Some explanation about the what Hull Moving average and ideas of how the generated in Big Snapper can be used:
tradingsim.com
forextradingstrategies4u.com
Inspiration from @vdubus
Big Snapper's Bollinger OutsideIn Swing filter in Action:

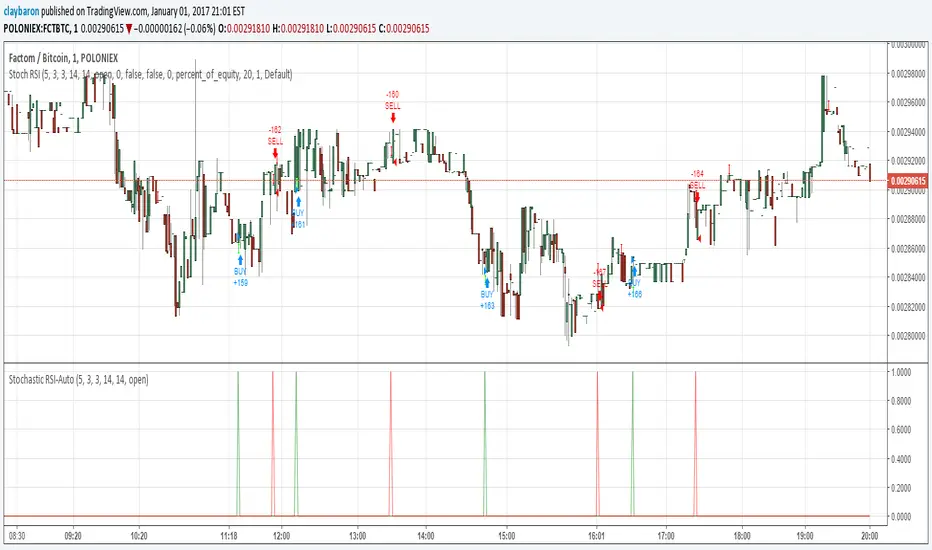
Stochastic RSI StrategyThis is an an adaption of Binary option 1 minute by Maxim Chechel to a strategy. I have had success with this on FCT/BTC on Poloniex.
Smart Money Setup 08 [TradingFinder] Binary Options Gold Scalper🔵 Introduction
In the Smart Money methodology, the market is understood as a structure driven by liquidity flow. This structure forms through the movement of large orders, the accumulation of liquidity, and the reactions that occur around key price zones. The logic of Smart Money is based on the idea that price movement is not random and usually evolves with the intention of collecting liquidity and creating price inefficiencies known as imbalances.
Within this framework, several important stages including the liquidity sweep, the formation of a point of interest, the appearance of an imbalance and the transition of market structure play major roles and collectively define the broader direction of price.
In many bullish scenarios, the market begins by sweeping sell side liquidity and targeting important lows in order to collect the liquidity resting below them. This liquidity collection often becomes the starting point for creating a point of interest which usually marks the area where Smart Money begins to enter the market.
After price moves away from this point, it breaks a structural high and forms a change of character. This shift marks a transition in the balance of power between buyers and sellers and is considered the first clear signal that the market structure is changing.
After the change of character, new institutional order flow often creates a strong and rapid movement that leaves behind an imbalance. This imbalance is one of the most important elements in Smart Money analysis because price tends to return to this area in order to complete structure and restore balance.
The return into the imbalance becomes meaningful when it occurs together with the liquidity sweep, the presence of a validated point of interest and a confirmed structural transition. These conditions frequently mark the beginning of powerful movements within the Smart Money cycle.
Understanding the sequence of liquidity, point of interest, imbalance, change of character and market structure builds the foundation of Smart Money analysis and provides a clear view of the true direction of institutional strength.
Bullish Setup :
Bearish Setup :
🔵 How to Use
To use this framework effectively, the trader must analyze the market through the principles of Smart Money and observe how liquidity drives price. A trade becomes valid only when several essential components appear together in a clear and consistent order.
These components include the liquidity sweep, the formation of a point of interest, the confirmation of a change of character, the transition of market structure and the return of price into an imbalance. The method is built on the understanding that the market first collects liquidity, then shifts order flow and finally provides an entry opportunity inside an inefficient area or inside a point of interest.
For this reason, the trader must follow the path of liquidity from the moment the sweep occurs, through the point of interest and the change of character and finally into the return of price toward the imbalance. When applied correctly, this approach creates entries that are more precise, more structural and more aligned with the real behavior of the market rather than with superficial signals.
🟣 Long Position
A bullish setup in Smart Money structure begins with a liquidity sweep on the sell side. The market first targets the areas where sell side liquidity is located and collects the stops and resting liquidity under previous lows. This collection is the condition that Smart Money requires to begin creating a new order flow. After this liquidity has been taken, a point of interest forms which is usually the last bearish candle or the effective demand zone that initiated the upward movement.
Price then moves away from the point of interest and breaks a structural high which creates a change of character. This event confirms that the market structure has moved from a bearish state to a bullish one and that buying pressure has taken control of the order flow. Following this shift, a strong upward movement often occurs and creates an imbalance between candles. This imbalance reflects the entrance of strong Smart Money orders and is seen as an important confirmation of bullish strength.
When price returns to this imbalance after the displacement, the market enters a phase where Smart Money aims to complete the corrective movement and continue the upward direction. The reaction inside the imbalance when combined with the liquidity sweep, the confirmed point of interest and the change of character completes the bullish setup and forms a structure that often leads to a continuation of the bullish trend.
🟣 Short Position
A bearish setup follows the same Smart Money logic but in the opposite direction. The market begins by collecting buy side liquidity and targets the highs where buy side liquidity and resting stops are located. This liquidity sweep on the buy side becomes the starting phase for Smart Money to initiate a downward order flow. After the liquidity is collected, a bearish point of interest forms which is usually the last bullish candle or the supply zone that created the initial drop.
Price then moves away from this point and breaks the first structural low. This creates a change of character to the downside which confirms that the market structure has transitioned from bullish to bearish and that selling pressure has gained control. After this shift, a strong downward displacement appears and leaves behind a bearish imbalance that clearly shows the dominance of sellers.
As price returns to this imbalance and corrects the inefficient movement, the bearish setup becomes complete as long as the market structure remains bearish. The combination of the buy side liquidity sweep, the bearish point of interest, the change of character, the imbalance and the corrective return creates the ideal structure that Smart Money uses to continue the downward movement and develop a reliable selling opportunity.
🔵 Settings
🟣 Logic Settings
Pivot Period : Defines how many bars are analyzed to identify swing highs and lows. Higher values detect larger, slower structures, while lower values respond to faster patterns. The default value of 5 offers a balanced sensitivity.
🟣 Alert Settings
Alert : Enables alerts for SMS08.
Message Frequency : Determines the frequency of alerts. Options include 'All' (every function call), 'Once Per Bar' (first call within the bar), and 'Once Per Bar Close' (final script execution of the real-time bar). Default is 'Once per Bar'.
Show Alert Time by Time Zone : Configures the time zone for alert messages. Default is 'UTC'.
🔵 Conclusion
The Smart Money approach demonstrates that price movement is not random or based on surface level patterns. Instead, it develops through a clear cycle of liquidity collection, structural transition and corrective movement toward key price zones. By recognizing events such as the liquidity sweep, the formation of the point of interest, the change of character and the return into the imbalance, the trader gains the ability to understand order flow more accurately and identify the true direction of market structure.
Both bullish and bearish setups show that the alignment of these elements creates a transparent view of institutional behavior and reveals the source of strong movements in the market. When the trader correctly identifies this sequence, entry points become more reliable and more aligned with liquidity flow. The combination of liquidity, structure and imbalance provides a consistent framework that removes guesswork and guides decisions through the real logic of the market.

Options Trading Max Success_V1DISCLAIMER:
The information provided is NOT financial advice. I am not a financial adviser, accountant or the like. This information is purely from my own due diligence and an expression of my thoughts, my opinions based on my personal experiences, and the way I transact.
Utilize this indicator at your own risk..! The indicator creator is not liable for your loss due to untimely action / adverse consequences / server lags from Tradingview (if any).
======================================================
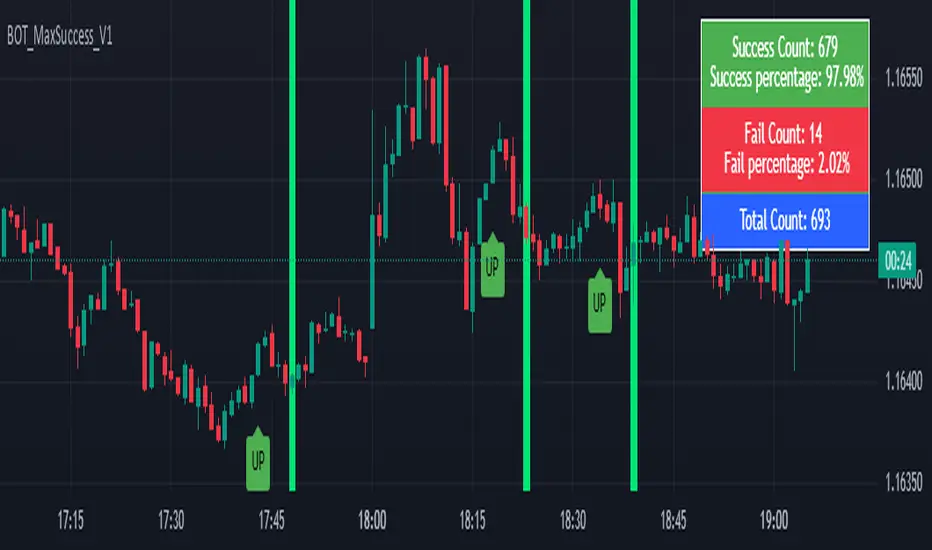
Welcome!
This is a 95-100% Success rate High Frequency Indicator exclusively for Binary Options Traders. It works on any time frames and pairs but is EXCLUSIVELY built for 1-minute candles for EUR/USD currency on "OANDA" forex chart. So, use it for same to get this indicator working at its best.
Use Martingale strategy (5 attempts max) for making profits / recover loss with some profits.
======================
Martingale Strategy For your knowledge with an example:
1) Lets say you are trading on binary options platform that gives 80% profit upon successful trade.
2) UP signal seen. You do the below from next candle:
a) 1st attempt = Rs.100.
- If Success, then profit = Rs.80. Cycle close and exit.
- If Loss, then do 2nd attempt.
b) 2nd attempt =Rs.200.
- If Success, then profit = Rs.160. (Rs. 100 recovery + Rs.60 Profit). Cycle close and exit.
- If Loss, then do 3rd attempt.
c) 3rd attempt = Rs. 400.
- If Success, then profit = Rs.320. (Rs. 300 recovery + Rs.20 Profit). Cycle close and exit.
- If Loss, then do 4th attempt.. and so on.
=======================
If you see any body less/Doji candle in between your attempts. Then do not continue further.
Hold this cycle for next similar stage. For example:
Select chart which promises: Success = 80% profit.
Then attempt the below on the next candle AFTER you see an UP signal.
Cycle 1: UP signal seen. 5 attempts from next candle:
Let's say:
1st attempt = Rs.100. Result = loss
2nd attempt =Rs.200. Result = loss
3rd attempt = Rs.400. Result = No profit/loss (due to Doji candle/candle without body).
Recommendation: Do not proceed further in current cycle. Hold on for next cycle/UP signal.
Park Rs.400 rupees attempt aside for a while.
Cycle 2: UP signal seen. 5 attempts from next candle:
Let's say:
1st attempt = Rs.100. Result = loss
2nd attempt =Rs.200. Result = Success
Cycle Completed. Wait for next cycle/Up signal
Cycle 3: UP signal seen. 5 attempts from next candle:
Let's say:
1st attempt = Rs.100. Result = loss
2nd attempt =Rs.200. Result = loss
3rd attempt = Now you can attempt with Rs. 800.
.
=====================
Recommendations:
- Keep a good discipline and make smart moves.
- You may add other supporting indicators of your choice along with this.
- You can keep your trading attempts low i.e. After you see an UP signal, let go the 1st one/two/three candles. If they turn out to be Red candles back to back, then good for you, as you can start entry of attempts from the 2nd/3rd/4th candle. Thereby evading one/two/three few failed attempts. If any candle gets green After Up signal and before your entry, then do not enter this cycle. Wait for next cycle.
Good luck.
================
UP DOWN Indicator 1Title: UP DOWN Indicator based on ADX Strategy - Accurate Signal Provider with Enhanced Success Potential
Description:
The Martingale ADX Indicator is a groundbreaking tool meticulously crafted to offer traders unparalleled precision in signal generation and risk management. Leveraging the power of the Average Directional Index (ADX), this indicator provides 100% non-repaint signals on the current candle, guiding traders to opportune and prepare for trade entry with remarkable accuracy.
With a focus on empowering traders across various financial markets, including Forex and Binary Options, this ADX Strategy-1 Indicator introduces a unique approach to trading dynamics. By seamlessly integrating the renowned Martingale Step-1 risk management strategy, this indicator not only minimizes losses but also enhances the potential for success, even in volatile market conditions.
Key Features:
Non-Repaint Signals: The Martingale ADX Indicator stands as a testament to reliability, offering 100% non-repaint signals. Traders can trust in the consistency and not removing losing Signals which is very important to trust the previous generated signals also, eliminating uncertainties and facilitating confident decision-making.
ADX-Based Precision: Built upon the robust framework of the Average Directional Index (ADX), this indicator delivers precise signals tailored to prevailing market trends and volatility levels. Whether trading in longer timeframes or engaging in Binary Options, traders can rely on the Martingale Step-1 ADX Indicator for superior insights.
Next Candle Trading: Seamlessly integrated into trading strategies, signals from the Martingale ADX Indicator prompt action on the subsequent candle. This real-time approach ensures traders stay ahead of market movements, seizing opportunities as they emerge. Giving Signals Once Candle ahead makes traders to prepare early and decide whether they want to enter the trade on presented Signal or not as per their own experience too. If the trading candle is loss then the very next candle shall be used for taking Martingale Sep-1 to enhance the Accuracy.
Enhanced Success Potential: With Martingale Step-1 risk management, this ADX Indicator offers more than just signal accuracy – it presents the potential for heightened success rates. Through strategic position sizing and leveraging experience and Price Action insights, traders can elevate overall accuracy to levels ranging from 80% to 90%.
Conclusion:
The UP DOWN Strategy-1 Indicator represents a paradigm shift in trading technology, combining precision signal generation with advanced risk management strategies. Whether you're a seasoned trader or just starting your journey, this indicator empowers you to navigate financial markets with confidence and achieve consistent results.
Experience the difference with the Martingale ADX Indicator – where reliability meets profitability, and success becomes attainable with every trade.
Trade wisely, and may your ventures be marked by prosperity and fulfillment.
Pardon for any descriptive language grammatical error and comment about this indicator and to get my other strategy as well. Happy trading !!
Risk Disclaimer:
Trading in financial markets carries inherent risks and should be approached with caution. It is imperative to exercise sound judgment and trade only with funds that you can afford to lose. We strongly advise against using borrowed funds for trading purposes. First practice on demo for own learning then make decision wisely.

IU Probability CalculatorHow This Script Works:
1. This script calculate the probability of price reaching a user-defined price level within one candle with the help Normal Distribution Probability Table.
2. Normal Distribution Probability Table is use for calculating probability of events, it's very powerful for calculation of probability and this script is fully based on that table.
3. It takes the Average True Range value or Standard Deviation value of past user-defined length bar.
4. After that it take this formula z = ( price_level - close ) / (ATR or Standard Deviation) and return the value for z, for the bearish side it take z = (close - price level) / (ATR or Standard Deviation ) formula.
5. Once we have the z it look into Normal Distribution Probability Table and match the value.
6. Now the value of z is multiple buy 100 in order to make it look in percentage term.
7. After that this script subtract the final value with 100 because probability always comes under 100%
8. finally we plot the probability at the bottom of the chart the red line indicates "The probability of price not reaching that price level", While the green line indicates "Probability of price Reaching that level " .
9. This script will work fine for both of the directions
How This Is Useful For The User:
1. With this script user can know the probability of price reaching the certain level within one candle for both Directions .
2. This is useful while creating options hedging strategies
3. This can be helpful for deciding stop loss level.
4. It's useful for scalpers for managing their traders and it can be use by binary option traders.

Quantum Cryptocurrency Strength Indicator (CCSI)Exciting new markets require exciting new indicators and with the plethora of cryptocurrencies now available and increasingly being offered through mainstream brokers, at Quantum Trading we thought it was time for us to step in and develop something unique to help traders and investors trading the new kids on the block.
Cryptocurrencies like their more established cousins in forex, are in a constant state of flux moving from overbought to oversold and back again, but at a much faster pace, and generally associated with volatility. The challenge of course is picking those phases of price action where these conditions have been met and so offering the trader two opportunities. Either to take a position ahead of any reversal and so get in early before the trend develops, or alternatively to wait until the trend is underway and then jump in. You can think of this as a train in the station. Do you board early before it leaves, or jump aboard once it is underway? Both approaches have advantages and disadvantages, but the choice is yours.
So, our development team set to work to deliver the perfect indicator to deliver this information for you visually and quickly, and we are proud to announce the Cryptocurrency Strength Indicator or the CCSI for short. And if you thought this looks similar to its hugely popular currency strength indicator for forex then you would be right.
This indicator is of course a little different, though the principles of how to use it can be considered the same. So how does it work? Well, first of all, here we are dealing with a cryptocurrency pair, rather than isolating out the currency itself, as every cryptocurrency is quoted against the USD in some way. In these markets we are seeing the movement of the cryptocurrency against the US dollar and in developing the indicator we have chosen to display this against Tether. In other words, USDT.
The indicator displays seven of the most popular cryptocurrencies against the USDT, but what we have also included in the design is the option to deselect these and select others of your choice, so you have complete control of those cryptocurrencies you wish to trade. In addition, we understand that alerts are a hugely popular function of the TradingView platform, so we have added these in these also. And of course, as you would expect we have included the option to isolate out those of interest. So how do we use the indicator?
First, as you might expect, the cryptocurrency market tends to move ‘en mass’ – in other words generally either moving higher or lower together. You can think of this as an equivalent to the currency matrix in forex, where currencies of one denomination, such as the yen will all move in the same direction if the yen is being bought or sold universally. It is the same here. On occasion, on the faster timeframes, one does see divergence, but as a general rule, they will all tend to move together which is great as it gives you the confidence you are trading in the direction of the entire market. What is important however is the direction of the USDT. This will ALWAYS be in the opposite direction which is why we isolate it out from the others, to reveal precisely how this is moving. Remember, what drives a strong trend is when one currency is rising and another falling in forex and it is exactly the same here. When the USDT is rising strongly and the cryptocurrencies are falling, then a strong trend is underway. Equally, if the USDT is falling strongly then you will see a strong trend in your chosen cryptocurrency.
Next, we look for overbought and oversold opportunities in precisely the same way as for the currency strength indicator. Cryptocurrencies are in a constant state of flux moving from oversold to overbought and back again in all timeframes so there are always plenty of opportunities to employ this tactic and get in early at the start of a new trend. The angle of inclination of the line reveals the strength of the move, but equally, if the cryptocurrencies are moving sideways along with the USDT then we have to wait and be patient. But the beauty of this market is that it genuinely trades twenty-four hours a day, and seven days a week. Trend trading is another great tactic and as soon as the move is underway you can jump on the moving train and join a current trend and with cryptocurrencies, you don’t normally have to wait long as the price action is constant.
However, don’t just think of the Cryptocurrency Strength Indicator as a tool for simply getting you in. It will also help you to stay in and get out at the right time. After all if it’s good enough to get you in then it’s good enough to keep you in also. But remember, when the lines are moving sideways along with the USDT, then it’s a question of being patient and waiting. In other words, it helps to keep you out too.
The indicator works in all timeframes on the TradingView platform from seconds and upwards, so all trading approaches and tactics are catered for with this indicator. It can be used with any instrument whether through a conventional broker or for trading binary options which are extremely popular, and of course cryptocurrency futures too.

ATFMWHAT TYPE OF MARKET TO USE?
ATFM indicator focus mainly on very short term trades specifically for 5min expiry. You can use this indicator in any type of market as long as theres 5 min expiry option available.
HOW IT WORKS?
ATFM indicator uses a combination of moving averages and trend analysis to trigger a BUY (blue arrow pointing up) or a SELL (red arrow pointing down) signal. When certain condition is met, it will immediately pop up an alert signal for you to take. It will trigger with all types of market condition. There is no repaint since it is based of the previous closed candle.
HOW TO USE?
When the signal triggers a “BUY” or “SELL” you want to wait for that candle to close and then you enter the next candle as your entry. If you’re trading binary options, you want to take the ATM (At the Money) contracts but make sure you enter the 5 min expiry. This indicator works best when you scalp. You can hold till expiry as well. You can turn on push notification on your phone so you won’t have to miss any signals.
This indicator is a month to month subscription. No Free trial. PM me to access the ATFM.

RSI with Bollinger Bands Binary system by Hashtag_binaryRSI with Bollinger Bands is binary options high/low trading system based on the volatility.
- Time frame 30min - 1H
- Expiry time 2 candles
- Markets: Forex currency pairs majors: EUR/USD, USD/CHF, GBP/USD, AUD/USD, NZD/USD, EUR/JPY, USD/JPY, AUD/JPY
Rules for RSI with Bollinger Bands Binary system
- Do not start before the economic news
- We wait for the price to eitherhit the lower bollinger band or the upper bollinger band and the moment this happens we take the trade immediatly.
Buy Put:
If the price touches the lower Bollinger band we and RSI is below the 30 we take a put.
Buy Call:
If the price touches the upper Bollinger band we and RSI is above the 70 we take a call.

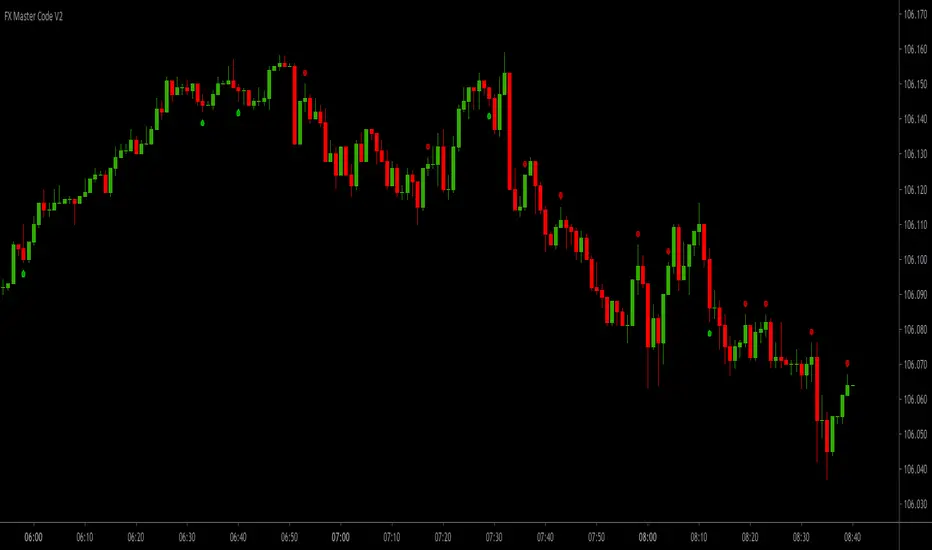
FX Master Code V2FX Master Code V2 (Non Repaint)
TradingView Account Needed: Free
Are you making the making the kind of results you want from trading right now?
Well, if the answer's no, then read this!
Even if you're a complete beginner in trading or an experienced trader, you can use these signals and alerts to start making great results.
The main goal of trading the 1-minute time frame is to make a profit through buying or selling currency pairs by holding a position for a very short period of time, and closing it for a profit.
FX Master Code will give you signals based on my proven and profitable 1-minute trading strategy.
You should be aware that this strategy will demand a certain amount of time and concentration. If you are not able to dedicate at least one hour a day to trade this strategy, then trading the 1-minute chart might not be the best strategy for you.
This is a day trading strategy suitable scalpers and binary options traders, as it involves opening a buy or sell position, gaining a few pips, and then closing the position 3 candlesticks after the signal (3 minute expiration time for binary options).
The exiting aspect of this is quantity. It is not unusual for traders to place more than +10 trades a day (and the more trades you place, the higher returns you can make).
Why not try FX Master Code and see if this system works for you?
The essence of the system will not allow for high losses. We will help you with risk management, use the best-practice risk and trade management for successful trading we give you with FX Master Code.
FX Master Code can be an extremely effective and profitable strategy – even for those who are beginners or use it purely as a supplementary strategy.
What is even better, using this strategy you are rewarded for quantitative work – the more trading you perform, the higher returns you can make.
If you want more details, the link is in the signature.
Disclaimer:
Past performance is not indicative of future performance. No representation is being made that any results discussed within the service and its related media content will be achieved. All opinions, news, research, analyses, prices or other information is provided as general market commentary and not as investment advice. TradingWalk, their members, shareholders, employees, agents, representatives and resellers do not warrant the completeness, accuracy or timeliness of the information supplied, and they shall not be liable for any loss or damages, consequential or otherwise, which may arise from the use or reliance of the TradingWalk service and its content. © 2019 TradingWalk.
TradingWalk indicators are built for TradingView. TradingWalk is on no way a part of TradingView.
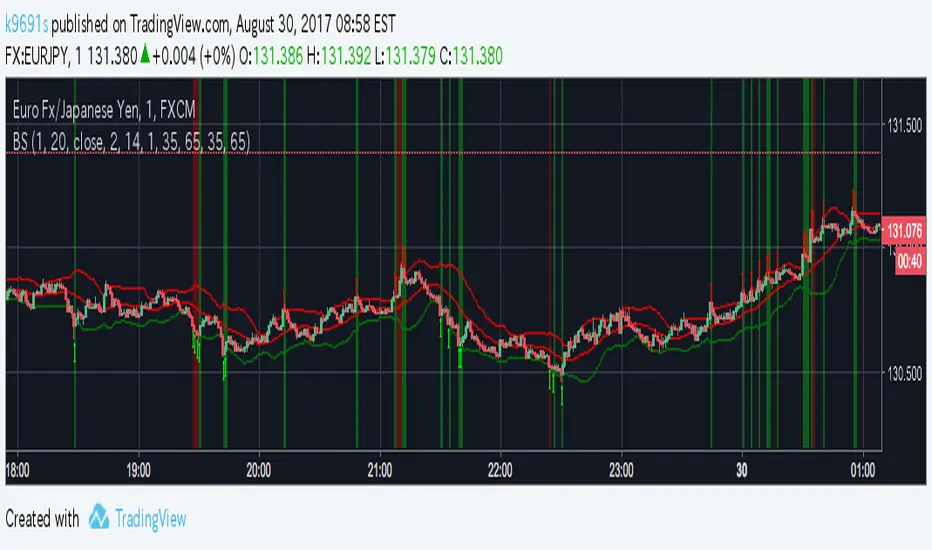
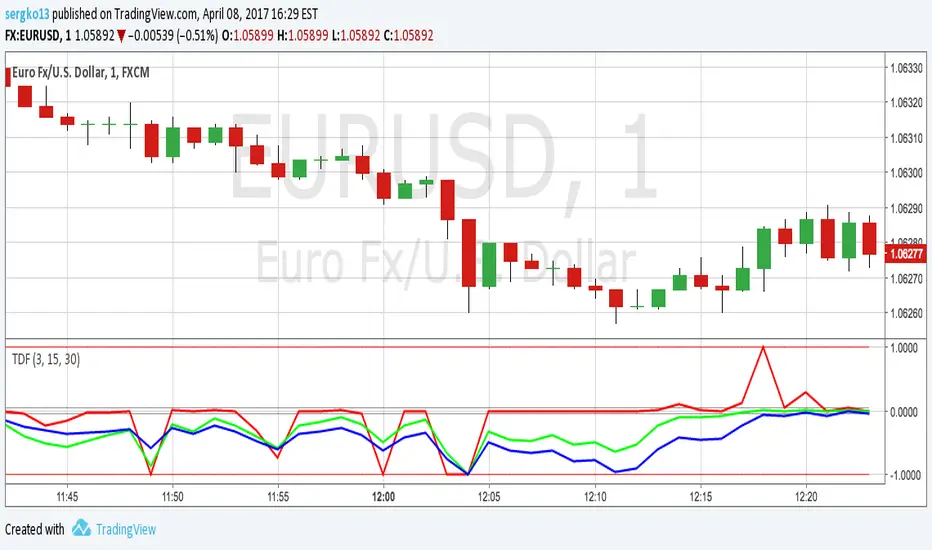
Trend Direction and Force IndexTrend direction and force index for binary options. Minor corrections to code. All invite-only scripts have been disabled
Binary 15 V1 w/ AlertsSo this is my first time coding Pinescript. I used bits and pieces of idea from smarter people like JustUncle, uscgears and Chris Moody.
I then combined bits and pieces and came with my own criteria for Binary Options.
Please use and provide feedback.
Rules:
Fuschia Bar: Sell for next available 15 min expiry
Yellow Bar: Buy for next available 15 min expiry
Notes:
When Stoch is OB/OS avoid trade
Alert Capable
Avoid trading in low volume times or during new releases

Vdub BinaryPro 1*Update*Vdub BinaryPro 1 *UPDATE
2 channel options
//////////////////////////////////////
pro2
pro2.1

Vdub BinaryPro 2 Releasing due to overwhelming multiple requests
Binary Pro 2
With the additional Binary Pro 2.1

[STRATEGY][UL]QQE Cross v1.1Updated by request: this is a "Strategy" trading version of the "QQE Cross Indicator Alert v2.0 by JustUncleL" (which is mainly for Binary Options trading), the same BUY/SELL signals are used to generate trade entry and exit conditions. Thanks again to JayRogers for making the Strategy risk management easier to understand and implement.
In this update I have added "Take Profit" option and cleaned up the risk management code. Also changed the close BUY/SELL order if EMA20 direction changes rather the next BUY/SELL opposite signal, making the close earlier.
BE ADVISED TO USE AT YOUR OWN RISK, even though back testing has shown good results, I don't have any Forex trading account to forward test against. You need to perform these test yourself and get back to me if there is any issues.

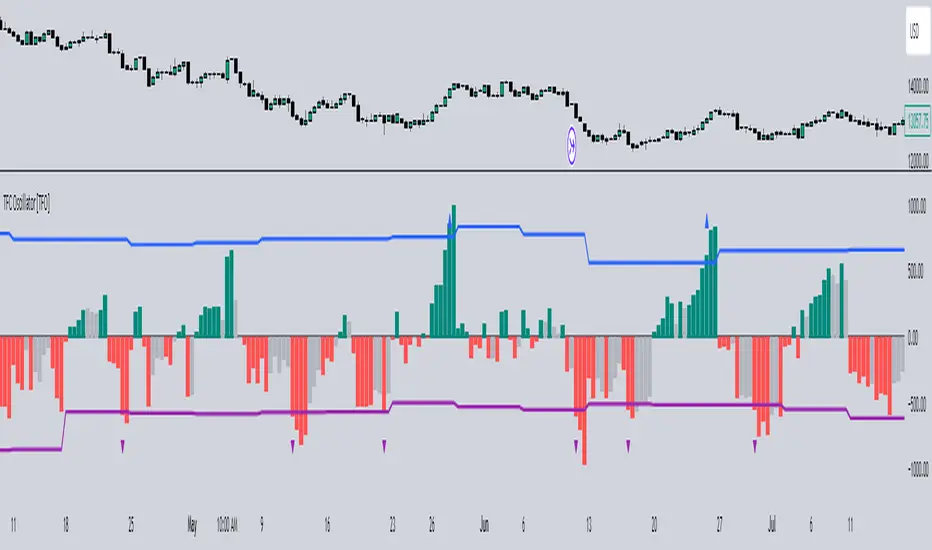
Timeframe Continuity Oscillator [TFO]This indicator is used to visualize timeframe continuity - a core concept of "The Strat" - along with some added logic for potential range limiters.
When discussing timeframe continuity, typically we are evaluating several timeframes to see if price is trading above or below the current open of each respective timeframe. If we are concerned with the 15m, 4h, and 1D for example, and price is trading above the current open of each of those timeframes, we can say that we have full timeframe continuity (FTFC) up. Conversely, if price is trading below the current open of each of those timeframes, we can say that we have FTFC down.
We can visualize this with an oscillator of sorts, where the zero line is anchored to the open price of the highest timeframe that we're concerned with. Using the prior example, this would be the 1D timeframe. As long as price is above the current 1D open, it is impossible to have FTFC down; and as long as price is below the current 1D open, it is impossible to have FTFC up. This is why we base the oscillator's values off of the highest timeframe's open (the values are simply how far price has traded from this open) - any value greater than zero tells us that there is potential to have FTFC up, and any value less than zero tells us that there is potential to have FTFC down.
There are a few ways we chose to visualize this data. First, we can choose the "Binary" option which simply uses one solid bullish color above the zero line, and one solid bearish color below the zero line.
Second, we can choose the "Gradient" option to help describe whether we have FTFC up or down. Values above the zero line will be a mix of the bullish color and mid color, where the mid color indicates no timeframe continuity up and the bullish color indicates FTFC up - sort of like a color spectrum of timeframe continuity to describe how many timeframes are in agreement. Similarly, values below the zero line will be a mix of the bearish color and the mid color, where the mid color again indicates no timeframe continuity down and the bearish color indicates FTFC down.
Lastly, we can choose the "FTFC Only" option which will only color the histogram bars as bullish if there is FTFC up, or bearish if there is FTFC down.
One more feature that we added is these upper and lower bands that aim to help describe the potential upper and lower limits that price may travel, relative to the highest timeframe's open. This is done by taking the standard deviation of some defined lookback period, for example, 2 standard deviations of the previous 10 weeks, assuming 1W is the highest timeframe enabled.
The concept is similar to that of an ADR (average daily range) as it can be used to estimate maximum range extensions for the largest timeframe. The arrows you see are plotted once the value exceeds either band - alerts can be enabled for these events as well through any alert() function call.
Om Boy CandlesUsed by me to play binary option.
A little project to help my nephew decide which candle to refer to make SNR lines

Binary Signals - MnetfGives binary options signals on NASDAQ.
Signals long or short positions on the current candle in the NAS100 index.
Is mostly perfect for long entry signals

Binary Sniper StrategyBy using this indicator you can better view the MA indicators used by this strategy, as well as specifically waiting for the cross and close which gives you easy access to an arrow as one of the confirmations and having the ability to setup alerts on the flip so you can easily monitor multiple pairs at the same time, the Bands give you a general idea of the market flow, and volatility.
The Long Term EMA gives you higher probability trend for a easier binary clear, potentially without the need for a rollover.
This is best used alongside:
- Stochastic Indicator with the Settings of (5,3,3)
The confirmations are :
- Are we Above or Below the Long Term Trend EMA - (Above = 1 Confirmation for the Buy, Below = 1 Confirmation for the Sell)
- Are we at the Low or the High of the Bands ( Low = 1 Confirmation for the Buy, High = 1 Confirmation for the Sell)
- Are the MAs crossed up or down( Cross Up = 1 Confirmation for the Buy , Cross Down = 1 Confirmation for the Sell)
- Are we coming out of the Oversold or Overbought areas on the Stoch (Oversold = 1 Confirmation for the Buy, OverBought = 1 Confirmation for the Sell)
- Is the 15 min in Confluence ? = (Yes = 1 Confirmation in either direction)
Once You have at least 3 Confirmations one of them having to be the MA cross arrow popping up, you have a valid trade setup on the open of that candle, for Binary options, I personally like to wait a little bit after the arrow candle opens to potentially get a slight pullback so that i can buy/sell with a slightly better entry that i don't have to rollover on, I usually aim for 3 min clears, but sometimes i have to rollover.

binary angelMeasure angles of many indicators and create score base on this information, it can be use as helper for direction decision in binary option or classic trading
